Weekly Technical Analysis Forecast – April 28, 2025

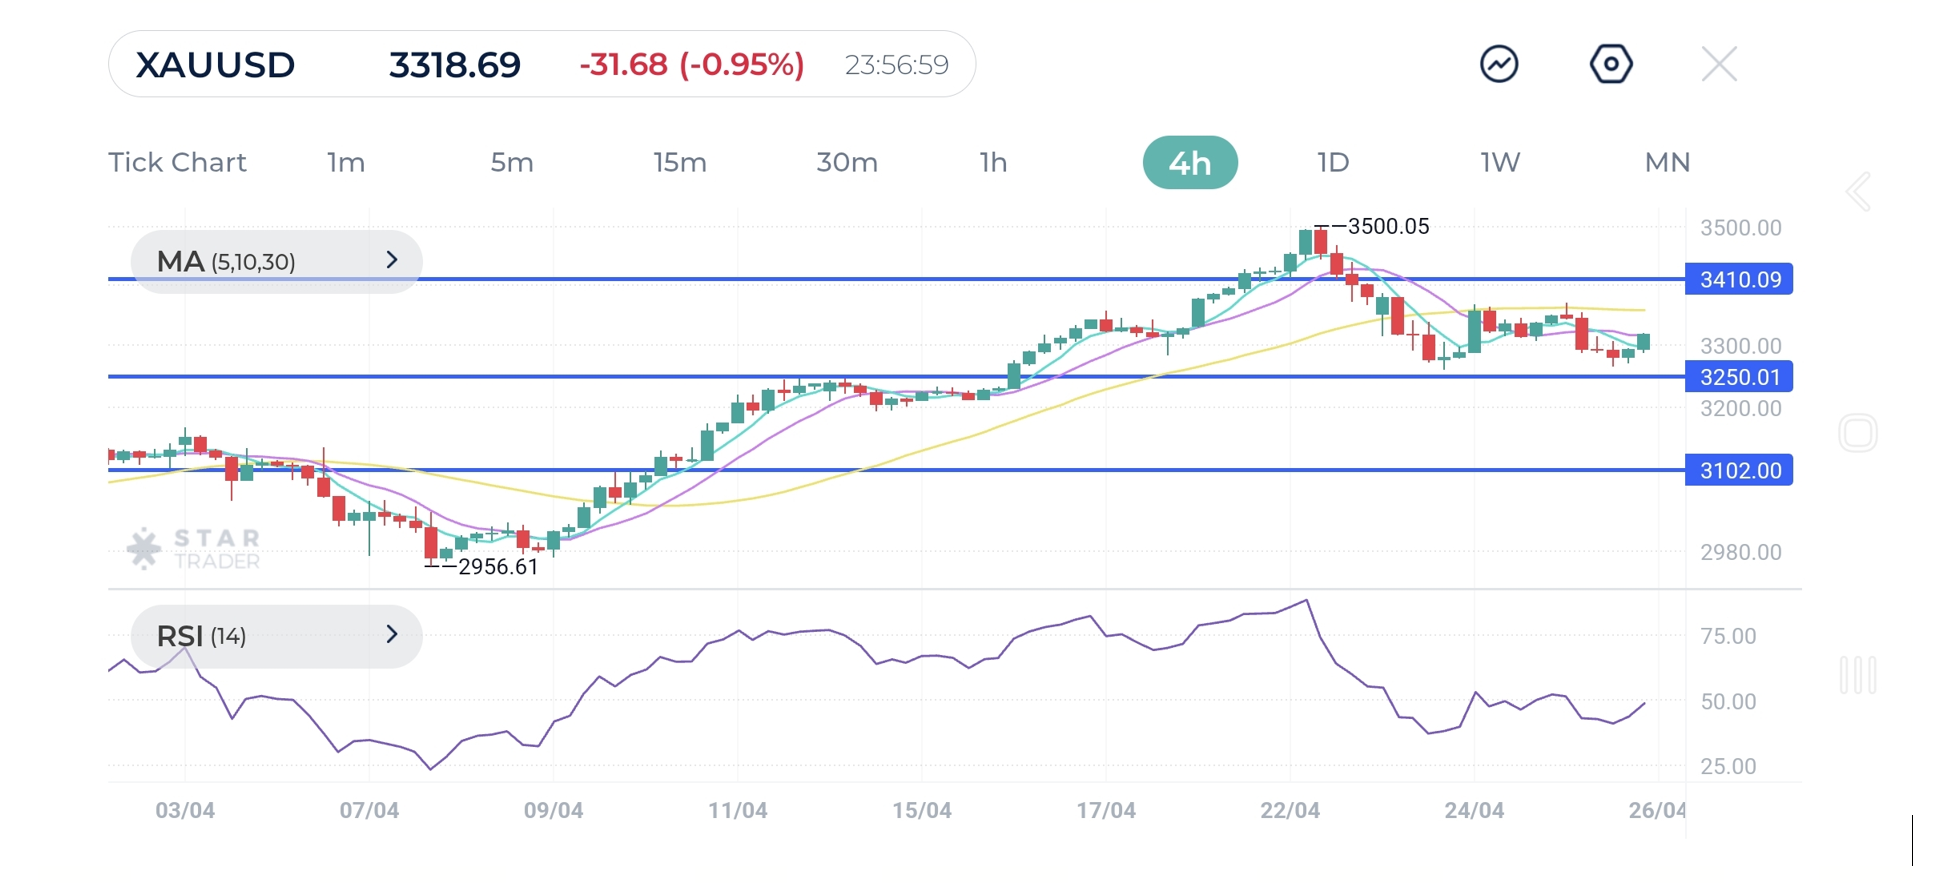
The gold price has been grinding lower in the latest trading sessions, breaking the 30-SMA, increasing negative pressure on the metal in the short-term. Meanwhile, the RSI has given additional negative signals, despite reaching oversold levels. Therefore, the outlook suggests further downside movement, provided the price remains settled below the 3435 level. A continued decline below 3250 could prompt more buyers to leave the table, exposing former resistance from mid-April and the round number of 3100. The expected trading range for the next few days is between the 3250 support and the 3410 resistance levels.
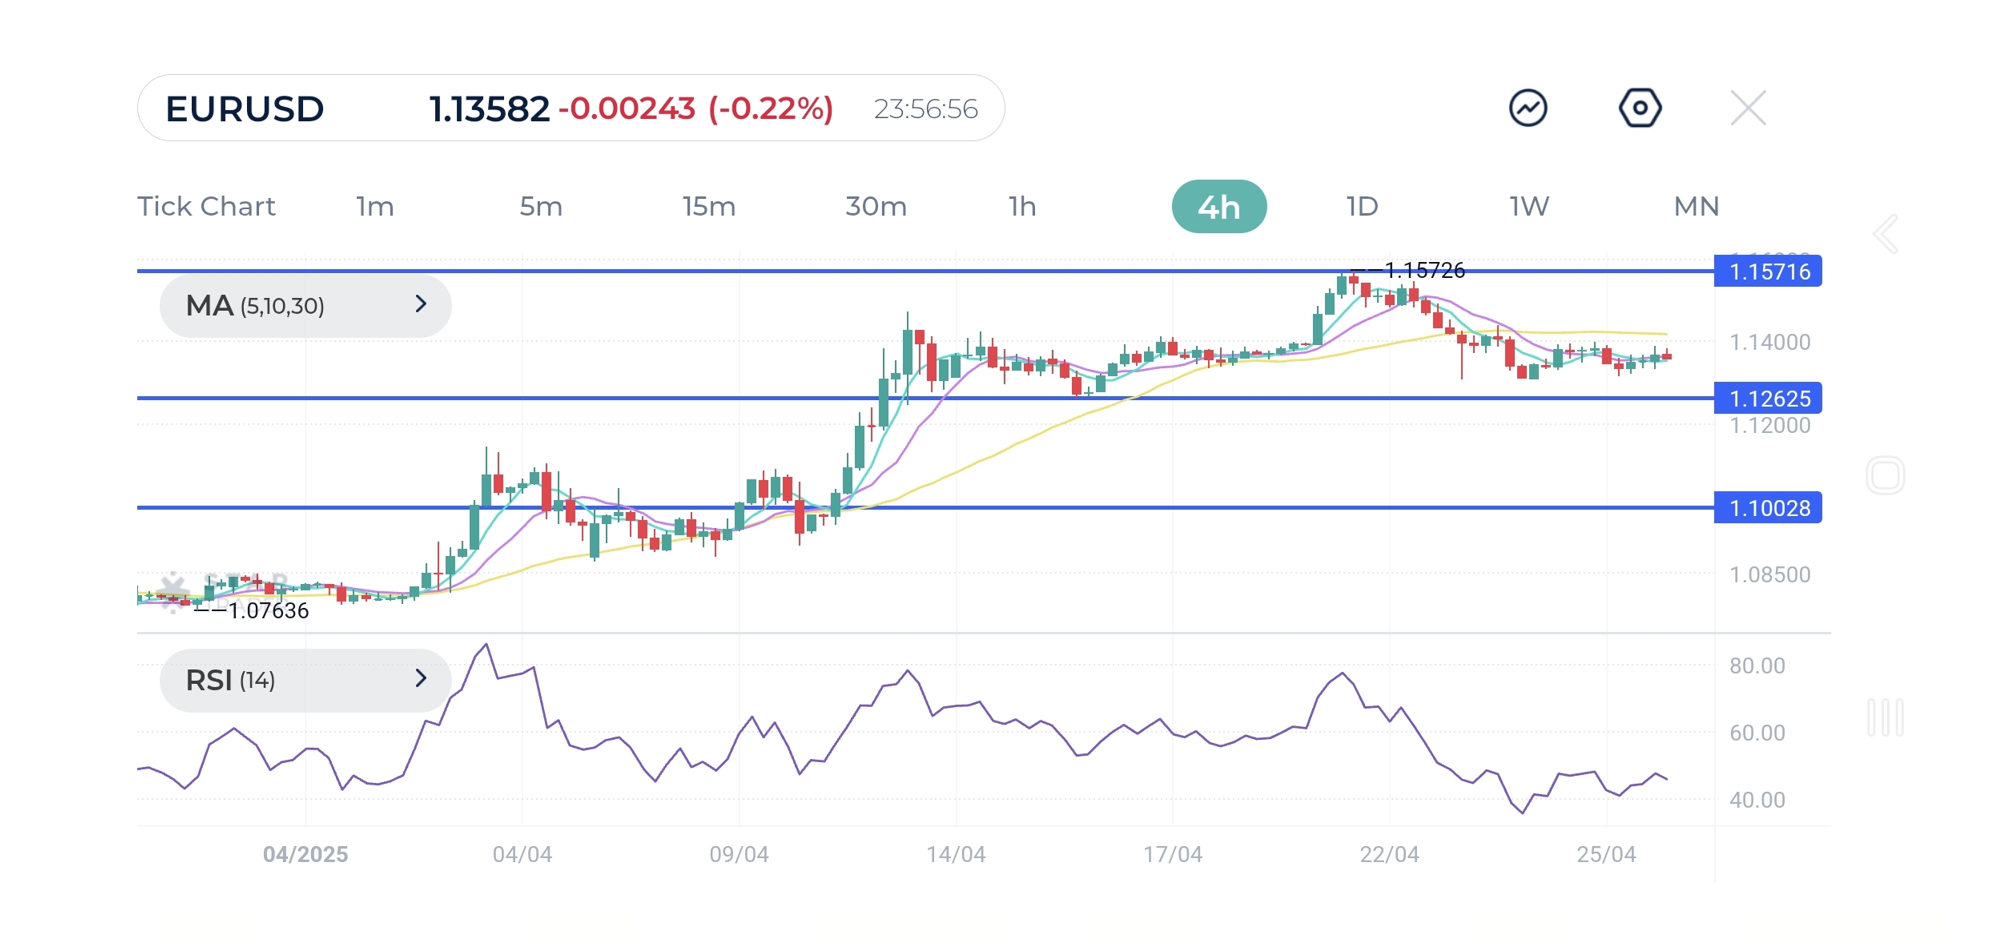
EUR/USD has broken below major support zones around 1.1350, signaling increasing bearish momentum. After encountering strong sellers at the 1.1570 resistance, the pair fell below a key support trendline and dropped under the 30-SMA, confirming a shift to bearish control. Meanwhile, the RSI has slipped below 50, further supporting the bearish outlook. However, for a full confirmation of a reversal, bears must break below the key level of 1.1260 where a decisive move beneath would open the path toward the 1.1000. If that support holds firm, though, bulls could stage a comeback, potentially leading to a retest of the 1.1570 peak.
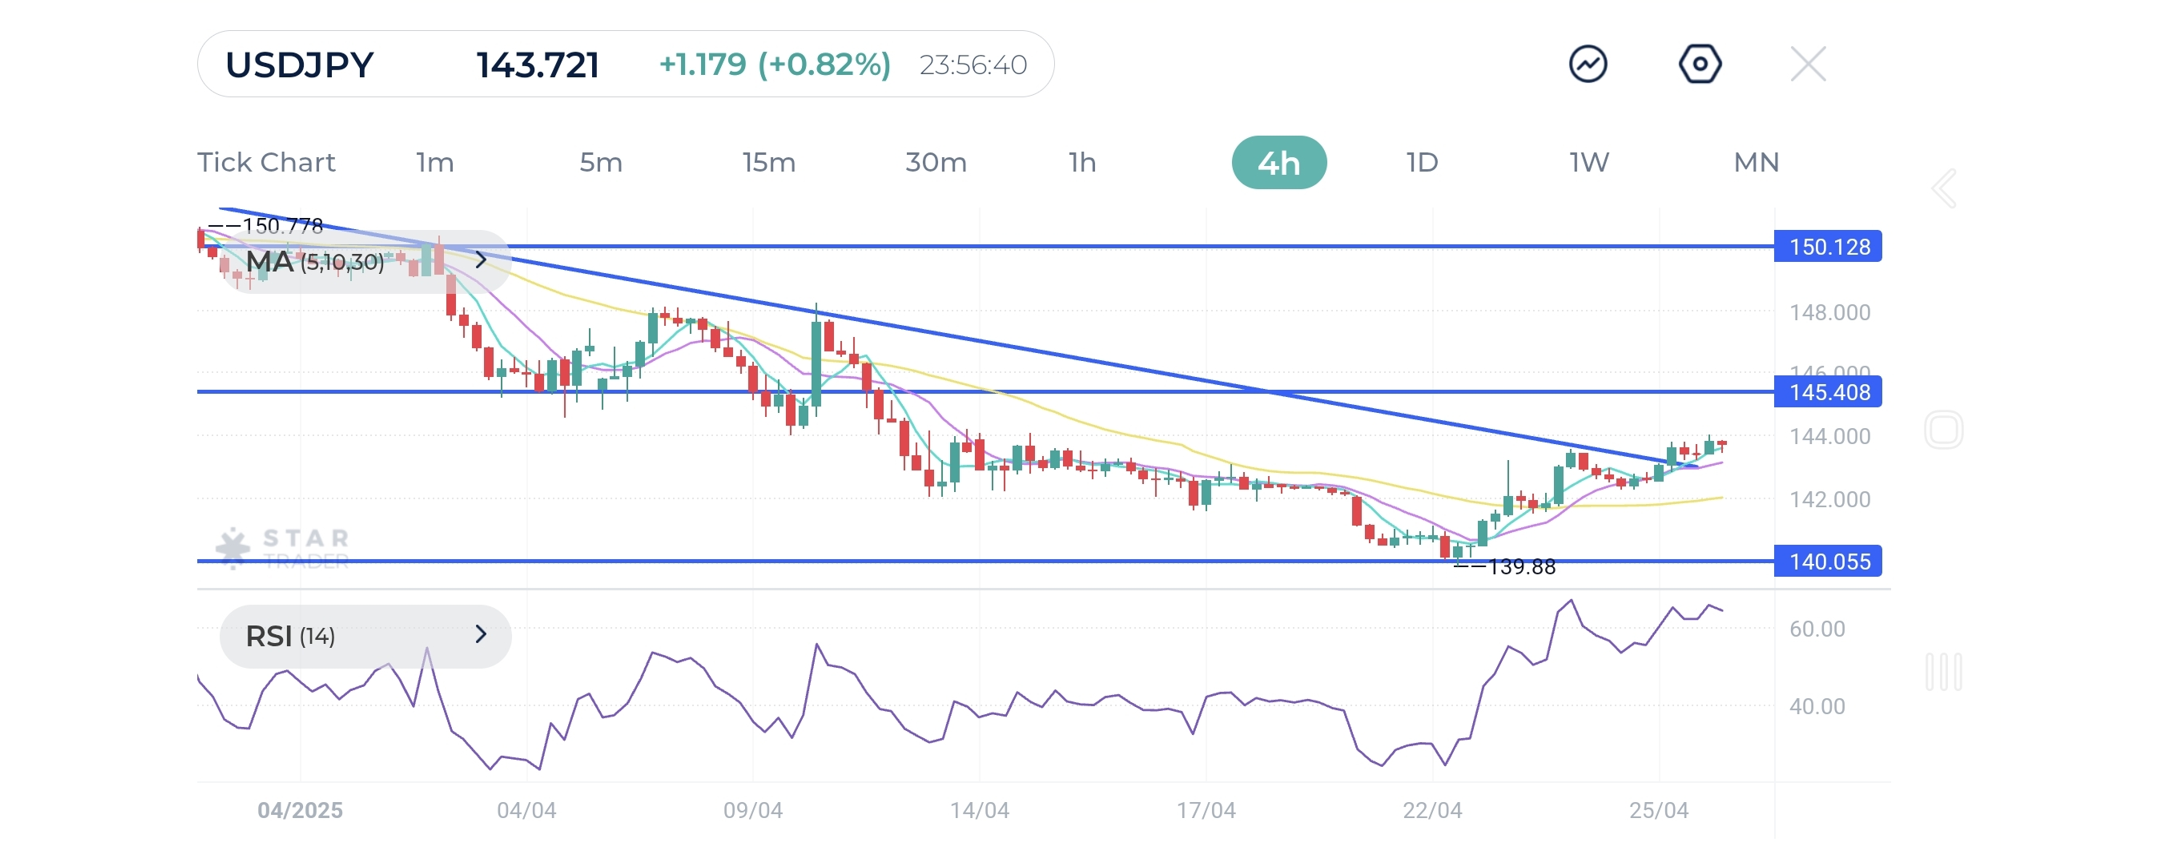
USD/JPY has broken out of its short-term bearish trendline from early April, rising above the 30-SMA, and signaling a bullish shift in sentiment. The price then saw a limited pullback and is trying to climb higher, reinforcing the breakout’s validity. Previously, bears controlled the trend, keeping the price below the SMA. But their momentum stalled at the psychological level of 140.00, allowing bulls to regain control by pushing the price above the SMA. The pair could soon retest the support-turned-resistance of 145.40 where a breach would confirm a new uptrend and strengthen the bullish bias.
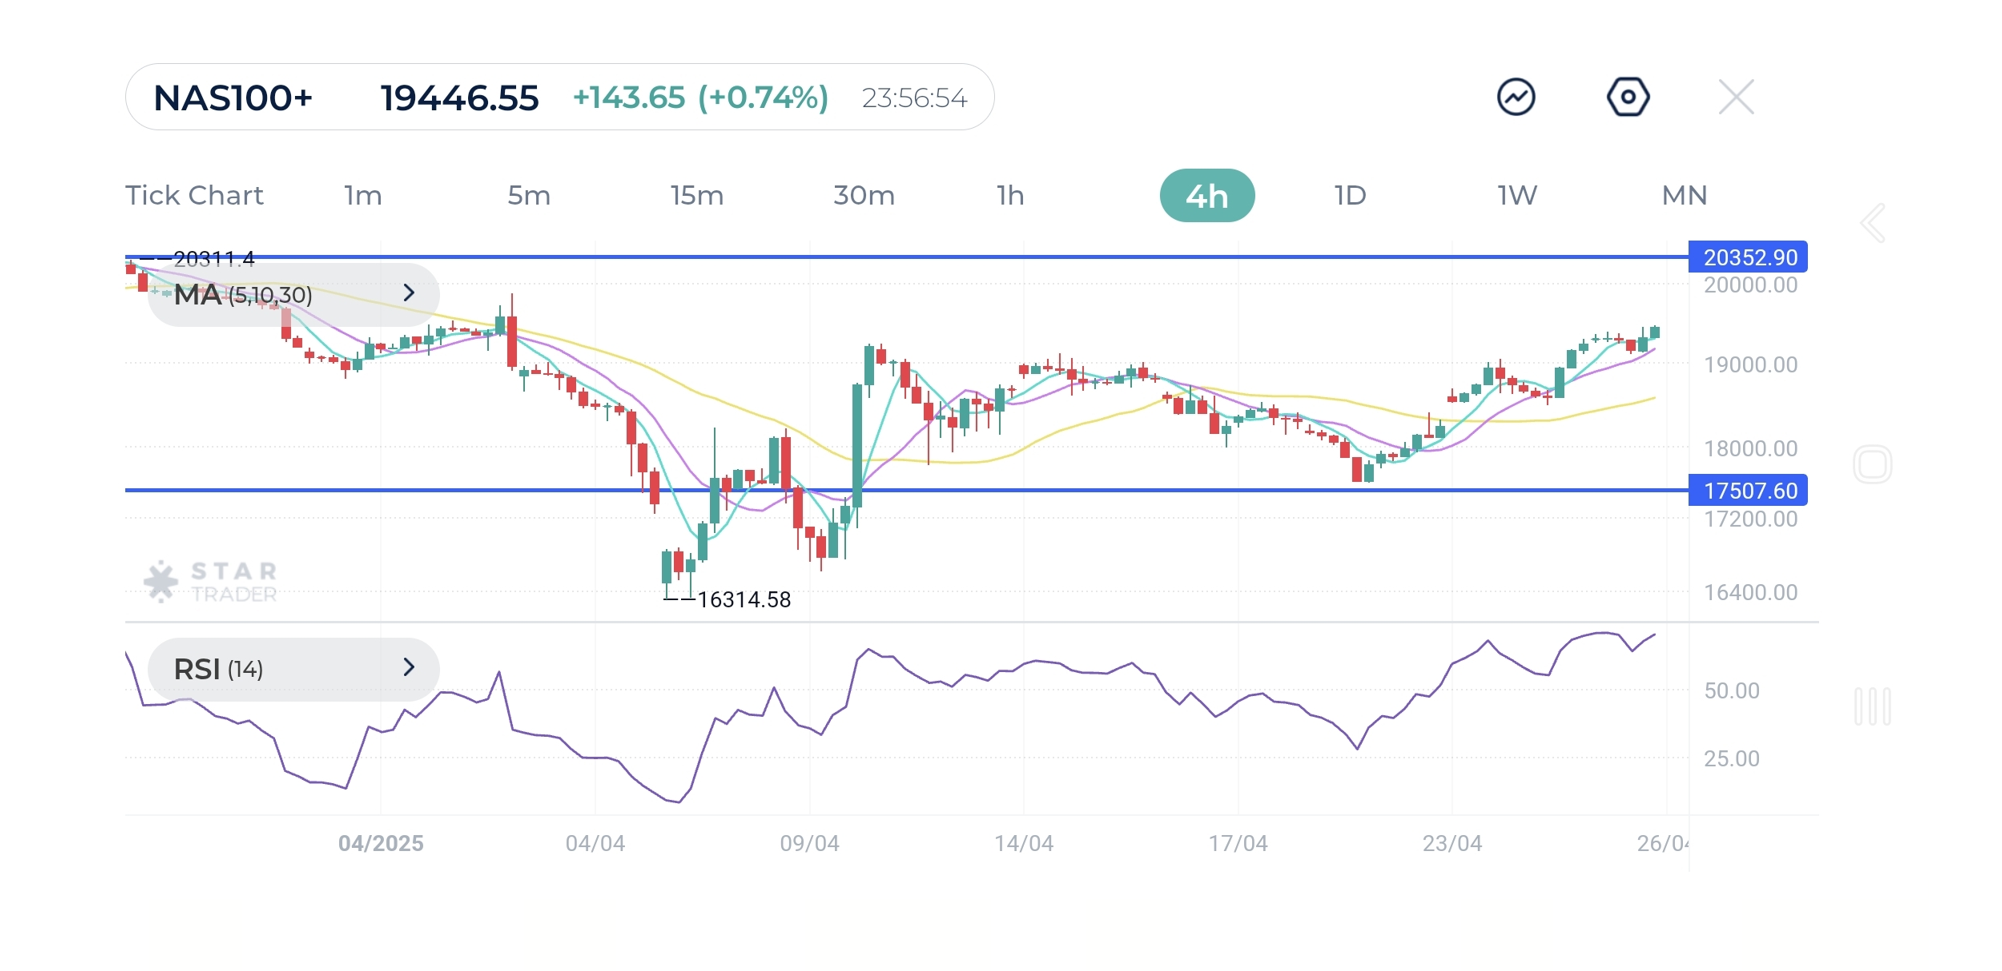
The Nasdaq 100 has broken the floor of the rising trendline from the daily chart perspective, indicating a weaker climbing rate at first or a more horizontal development in the weeks to come. However, the index has successfully cleared the resistance level of 19200, giving a positive signal for the short-term trading range. Immediate support is now seen at 17500, with 16310 as a critical level to keep the rebound intact. On the upside, 20350 stands as major resistance. Overall, the index is assessed as technically slightly positive for the near term.