


05 July 2022 – U.S. Dollar Targets Record Highs
market news summary
U.S. Dollar Index (USDX)
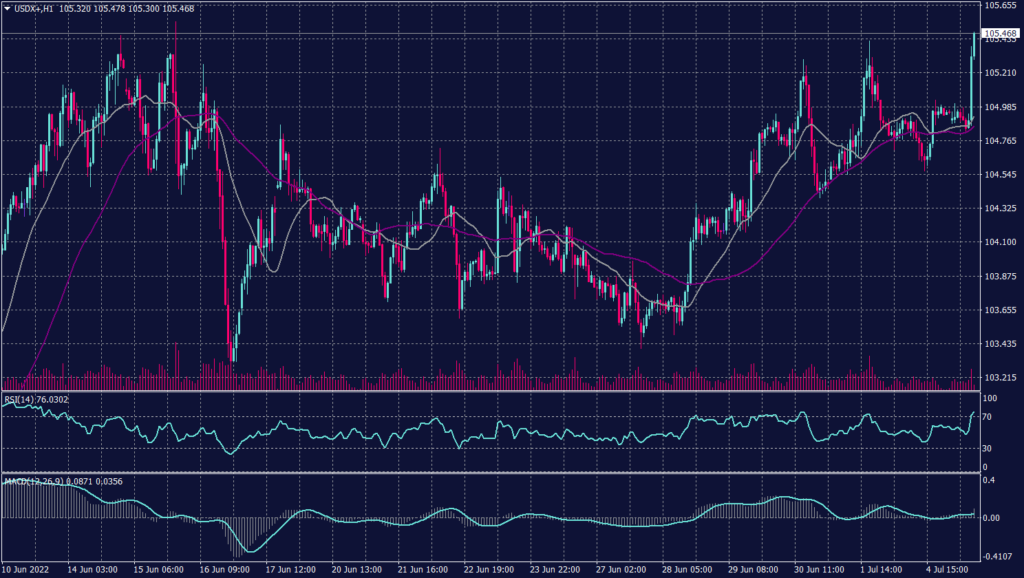
The dollar was up on Tuesday morning in Asia, gaining support from a strong rebound in the U.S. 10-year Treasury yields. U.S. 10-year Treasury yields pushed past 2.959% after reopening from a holiday, from the lowest since May at 2.7910% on Friday. Meanwhile, the U.S. Dollar Index stabilized above 105.20 and targets a new high.
The daily chart indicates a continuation of the uptrend in the long term towards a new all-time high. Technical indicators can’t confirm the continuation while moving averages show horizontal signals. The hourly chart shows an upward movement but keeps the tendency for a slight decline on the way.
PIVOT POINT: 105.40
| SUPPORT | RESISTANCE |
| 105.30 | 105.80 |
| 105.00 | 106.10 |
| 104.60 | 106.40 |
Euro (EURUSD)
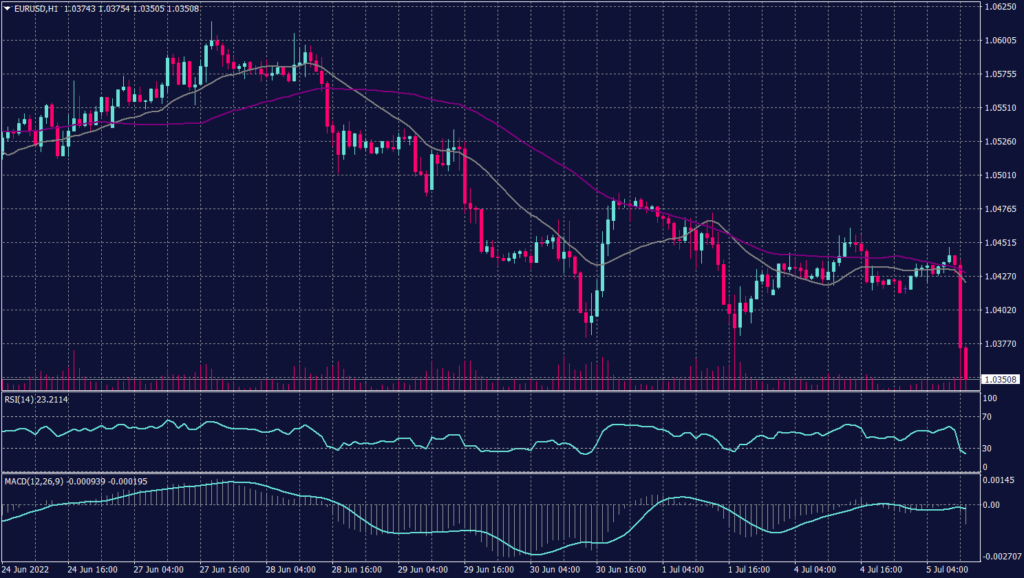
The euro rose 0.13% to $1.0435, gaining support after Bundesbank chief Joachim Nagel said the very accommodative stance of the European Central Bank (ECB) would “swiftly be abandoned” and a restrictive policy stance might be needed to achieve the inflation target. The policy outlook may not sustain the euro longer term, National Australia Bank markets economist Tapas Strickland said in a note.
The Euro pair drops to a new 20 years low and hinders any sign of recovery. The overall direction remains strong selling trend reaching below 1.03500.
PIVOT POINT: 1.0320
| SUPPORT | RESISTANCE |
| 1.0280 | 1.0375 |
| 1.0240 | 1.0480 |
| 1.0190 | 1.0510 |
Spot Gold (XAUUSD)
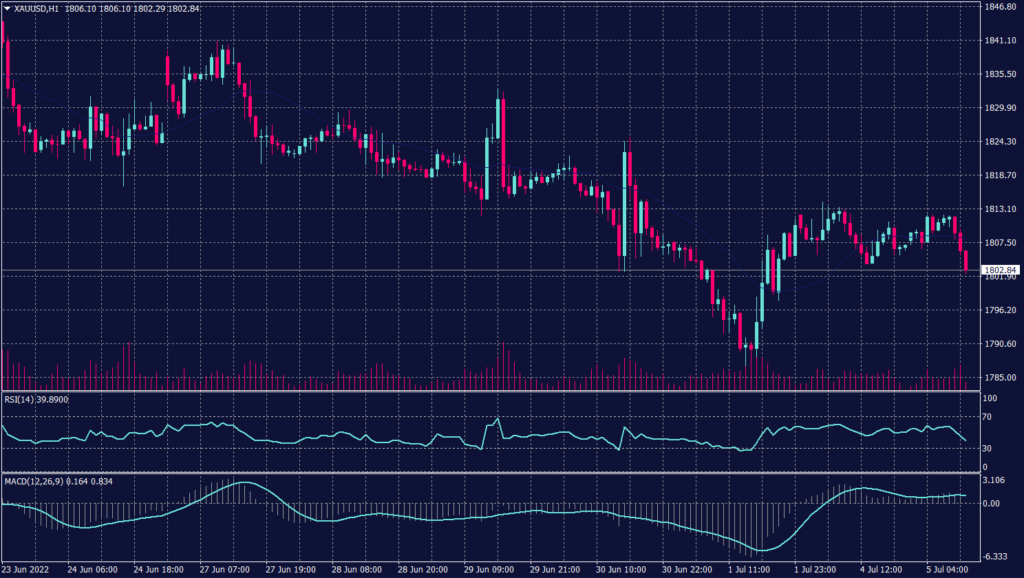
Gold prices rose marginally on Tuesday, buoyed by economic growth concerns, although an elevated dollar and impending interest rate hikes kept gains in check. Spot gold was up 0.1% to $1,810.45 per ounce while U.S. gold futures gained 0.6% to $1,812.20.
Technically:
Gold broke below the support at $1,800 which confirms a drop towards $1,785. The daily chart, however, show a continuation of the negative trend towards $1,750 unless the prices pounced to 1,840, which is technically not as easy as the decline.
PIVOT POINT: 1,800
| SUPPORT | RESISTANCE |
| 1,785 | 1,820 |
| 1,770 | 1,814 |
| 1,750 | 1,842 |
West Texas Crude (USOUSD)
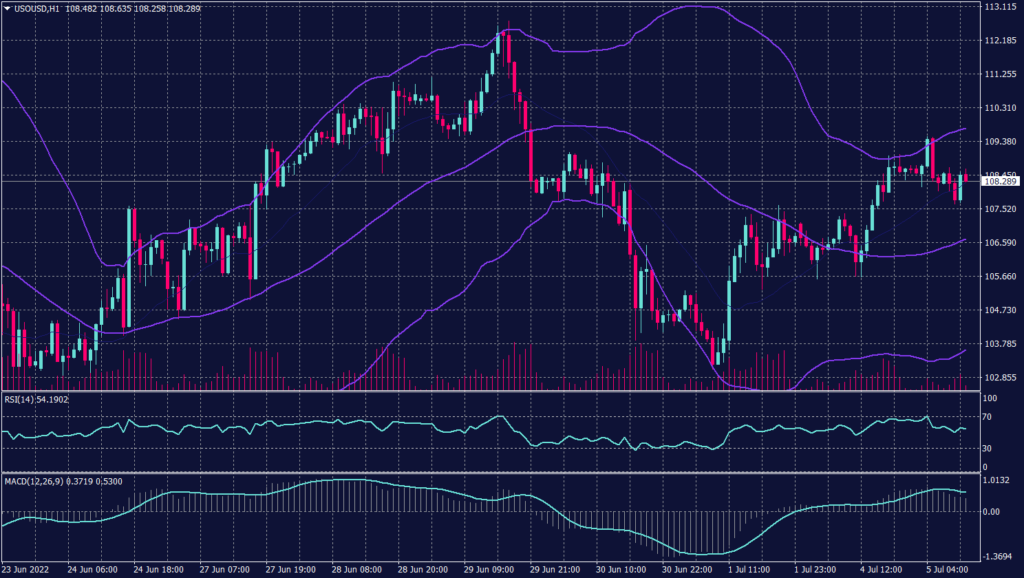
Oil was up over supply tightness concerns as a strike in Norway threatened to disrupt oil and gas output. On Tuesday, Norwegian offshore workers began a strike that is expected to reduce oil and gas output by 89,000 barrels per day. Brent oil futures rose 0.23% to $113.7 and WTI futures jumped 1.86% to $110.46.
Technically:
On the hourly chart, WTI prices show a decrease in volume traded due to the worries about the global growth and consumption. However, the daily chart confirms the high probability of the decline and targets $98 a barrel before any serious gains happen.
PIVOT POINT: 108.30
| SUPPORT | RESISTANCE |
| 103.40 | 108.90 |
| 102.20 | 109.50 |
| 100.00 | 111.00 |
